
Well, here we are with the Estado de Alerto deactivated a fortnight ago and things are not that bad, despite worries that things would go pear shape.
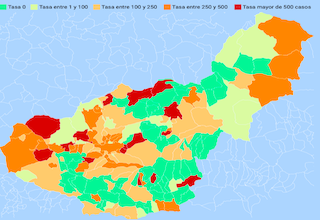 A third of all the municipalities in the province haven’t had one case in the last two weeks. In fact, Granada has more towns like this than other provinces of Andalucía
Take the cases of Vélez de Benaudalla, Pedro Martínez, Chimeneas, Nevada and Galera who have registered zero cases in a fortnight and that is despite the lifting of the Estado de Alarma and unrestricted mobility within the region.
The city of Granada, on the other hand, has seen it contagion rate climb 31 points with a present contagion rate per 100,000 inhabitants of 291.9, which is above the provincial average at the moment.
Anyway, here are your contagion figures – we haven’t done one for a while, as you know, so we thought that such information wouldn’t go amiss today.
As alway, if you can’t find your town or village below, it is because it hasn’t had one case in the last 14 days.
| Municipality | inhabitants | Cases in 14 Days |
Per 100,000 |
Cured | Deaths |
| Granada | 919,168 | 2,241 |
243.8 |
79,477 | 1,752 |
| Granada Sur | 148,993 | 291 |
195.3 |
6,669 | 110 |
| Albuñol | 7,353 | 26 |
353.6 |
389 | 5 |
| Almuñécar | 25,927 | 39 |
150.4 |
997 | 13 |
| Cádiar | 1,465 | 1 |
68.3 |
24 | 0 |
| Gualchos | 5,190 | 1 |
19.3 |
245 | 5 |
| Lanjarón | 3,530 | 4 |
113.3 |
130 | 4 |
| Lentegí | 333 | 1 |
300.3 |
1 | 0 |
| Molvízar | 2,772 | 1 |
36.1 |
79 | 1 |
| Motril | 58,460 | 144 |
246.3 |
3,076 | 42 |
| Órgiva | 5,784 | 9 |
155.6 |
287 | 4 |
| Pampaneira | 317 | 1 |
315.5 |
9 | 2 |
| Polopos | 1,722 | 1 |
58.1 |
49 | 2 |
| Pórtugos | 368 | 2 |
543.5 |
34 | 0 |
| Salobreña | 12,513 | 26 |
207.8 |
435 | 5 |
| Soportújar | 264 | 2 |
757.6 |
15 | 0 |
| Sorvilán | 527 | 2 |
379.5 |
34 | 0 |
| Torrenueva Costa | 2,796 | 4 |
143.1 |
70 | 2 |
| Ugíjar | 2,517 | 27 |
1,072.7 |
163 | 5 |
| Granada Nordeste | 97,710 | 112 |
114.6 |
7.919 | 192 |
| Alamedilla | 569 | 3 |
527.2 |
77 | 1 |
| Aldeire | 630 | 1 |
158.7 |
51 | 2 |
| Baza | 20,430 | 5 |
24.5 |
1,541 | 31 |
| Beas de Guadix | 329 | 2 |
607.9 |
19 | 0 |
| Benalúa | 3,310 | 7 |
211.5 |
311 | 14 |
| Benamaurel | 2,260 | 5 |
221.2 |
145 | 2 |
| Caniles | 4,021 | 2 |
49.7 |
243 | 9 |
| Castril | 2,020 | 1 |
49.5 |
137 | 1 |
| Cúllar | 4,091 | 15 |
366.7 |
213 | 1 |
| Darro | 1,634 | 1 |
61.2 |
192 | 3 |
| Fonelas | 978 | 7 |
715.7 |
65 | 1 |
| Gor | 744 | 1 |
134.4 |
26 | 2 |
| Gorafe | 383 | 1 |
261.1 |
15 | 1 |
| Guadix | 18,436 | 36 |
195.3 |
1,785 | 46 |
| Huéscar | 7,195 | 2 |
27.8 |
764 | 25 |
| Jérez del Marquesado | 955 | 1 |
104.7 |
60 | 1 |
| Lanteira | 564 | 1 |
177.3 |
43 | 1 |
| Marchal | 414 | 2 |
483.1 |
16 | 2 |
| Orce | 1,185 | 3 |
253.2 |
76 | 4 |
| Puebla de Don Fadrique | 2,238 | 10 |
446.8 |
255 | 4 |
| Purullena | 2,306 | 2 |
86.7 |
234 | 2 |
| Valle del Zalabí | 2,105 | 4 |
190.0 |
142 | 1 |
| Granada (distrito) | 240,363 | 686 |
285.4 |
24,483 | 547 |
| Granada (capital) | 233,648 | 682 |
291.9 |
23,869 | 541 |
| Huétor de Santillán | 1,882 | 1 |
53.1 |
165 | 1 |
| Jun | 3,853 | 3 |
77.9 |
384 | 3 |
| Metropolitano de Granada | 432,102 | 1,148 |
265.7 |
39,931 | 885 |
| Albolote | 18,962 | 40 |
210.9 |
1,775 | 24 |
| Alfacar | 5,488 | 23 |
419.1 |
584 | 10 |
| Algarinejo | 2,467 | 8 |
324.3 |
341 | 15 |
| Alhama de Granada | 5,867 | 8 |
136.4 |
376 | 7 |
| Alhendín | 9,509 | 22 |
231.4 |
780 | 13 |
| Armilla | 24,340 | 54 |
221.9 |
2,100 | 39 |
| Atarfe | 18,960 | 54 |
284.8 |
1,688 | 53 |
| Benalúa de las Villas | 1,054 | 4 |
379.5 |
101 | 1 |
| Cájar | 5,205 | 4 |
76.8 |
430 | 15 |
| Calicasas | 638 | 1 |
156.7 |
42 | 0 |
| Campotéjar | 1,229 | 7 |
569.6 |
86 | 3 |
| Cenes de la Vega | 8,153 | 23 |
282.1 |
607 | 12 |
| Chauchina | 5,552 | 20 |
360.2 |
720 | 13 |
| Churriana de la Vega | 15,689 | 67 |
427.1 |
1,476 | 35 |
| Cijuela | 3,415 | 12 |
351.4 |
341 | 9 |
| Cogollos de la Vega | 2,007 | 5 |
249.1 |
242 | 8 |
| Colomera | 1,302 | 4 |
307.2 |
218 | 1 |
| Cúllar Vega | 7,547 | 15 |
198.8 |
732 | 11 |
| Deifontes | 2,600 | 2 |
76.9 |
239 | 8 |
| Dílar | 2,092 | 9 |
430.2 |
123 | 2 |
| Dúdar | 327 | 2 |
611.6 |
12 | 0 |
| Dúrcal | 7,111 | 14 |
196.9 |
612 | 9 |
| Escúzar | 791 | 2 |
252.8 |
97 | 4 |
| Fuente Vaqueros | 4,384 | 4 |
91.2 |
622 | 12 |
| Gabias (Las) | 21,543 | 65 |
301.7 |
1,861 | 22 |
| Gójar | 5,909 | 20 |
338.5 |
426 | 3 |
| Guadahortuna | 1,872 | 10 |
534.2 |
120 | 2 |
| Güéjar Sierra | 2,857 | 5 |
175.0 |
217 | 7 |
| Güevéjar | 2,640 | 7 |
265.2 |
178 | 4 |
| Huétor Tájar | 10,399 | 27 |
259.6 |
974 | 25 |
| Huétor Vega | 12,035 | 23 |
191.1 |
1,166 | 11 |
| Íllora | 10,065 | 2 |
19.9 |
1,121 | 27 |
| Iznalloz | 5,120 | 7 |
136.7 |
625 | 26 |
| Láchar | 3,513 | 13 |
370.1 |
400 | 14 |
| Loja | 20,419 | 58 |
284.0 |
2,097 | 54 |
| Malahá (La) | 1,784 | 15 |
840.8 |
145 | 2 |
| Maracena | 22,306 | 86 |
385.5 |
1,979 | 45 |
| Moclín | 3,622 | 3 |
82.8 |
312 | 11 |
| Monachil | 8,007 | 19 |
237.3 |
626 | 6 |
| Montefrío | 5,313 | 30 |
564.7 |
448 | 15 |
| Montejícar | 2,110 | 4 |
189.6 |
192 | 6 |
| Montillana | 1,129 | 1 |
88.6 |
116 | 2 |
| Moraleda de Zafayona | 3,117 | 14 |
449.1 |
232 | 9 |
| Nigüelas | 1,185 | 2 |
168.8 |
76 | 2 |
| Nívar | 1,036 | 3 |
289.6 |
78 | 0 |
| Ogíjares | 14,348 | 57 |
397.3 |
1,414 | 29 |
| Villa de Otura | 6,982 | 16 |
229.2 |
546 | 10 |
| Padul | 8,694 | 13 |
149.5 |
835 | 12 |
| Peligros | 11,492 | 34 |
295.9 |
1,415 | 48 |
| Pinos Genil | 1,490 | 12 |
805.4 |
97 | 2 |
| Pinos Puente | 9,894 | 59 |
596.3 |
1,058 | 33 |
| Pulianas | 5,466 | 14 |
256.1 |
596 | 3 |
| Quéntar | 947 | 5 |
528.0 |
60 | 2 |
| Salar | 2,621 | 16 |
610.5 |
244 | 2 |
| Santa Cruz del Comercio | 531 | 2 |
376.6 |
71 | 1 |
| Santa Fe | 15,222 | 23 |
151.1 |
1,532 | 55 |
| Valderrubio | 2,066 | 4 |
193.6 |
208 | 2 |
| Valle (El) | 907 | 1 |
110.3 |
54 | 3 |
| Vegas del Genil | 11,432 | 23 |
201.2 |
931 | 22 |
| Villanueva Mesía | 2,021 | 4 |
197.9 |
184 | 4 |
| Víznar | 993 | 4 |
402.8 |
62 | 1 |
| Zafarraya | 2,120 | 1 |
47.2 |
106 | 0 |
| Zagra | 885 | 2 |
226.0 |
81 | 2 |
| Zubia (La) | 19,330 | 40 |
206.9 |
1,821 | 35 |
(News: Granada, Andalucia)
Kurt: thanks very much – I really do appreciate this encouragement and will certainly keep the figures coming. 😉
Hi Martin!
What you publish is just great, especially the weekly figures about the development of the contagion.
Why is it good? Because it is the only place where I can find out whether I should come to my house in Salobreña or stay put in the cold Denmark.
Please keep the numbers going 🙂
Kurt
What is the current status in Almuñécar as far as bars and restaurants go?